Table of Contents
Microsoft Excel has been around for four decades. It's still used by multi-billion-pound enterprises. For the majority of startups and small businesses it remains the default tool for day-to-day operational management. Spreadsheets are affordable, familiar and quick to set up - which is exactly why they persist.
For buyers, sellers and carriers, simple data tables are useful information capture and communication tools used across almost every industry. For small and localised functional teams, spreadsheet-based modelling and reporting remain the most common management tools in circulation.
The problem runs deeper than small teams relying on spreadsheets for core processes. According to an Adelante SCM survey reported by Supply Chain Dive, 67% of supply chain managers still count Excel as a management system. That figure holds even among businesses that have invested heavily in enterprise technology. Organisations running SAP, Oracle or other large-scale ERP platforms still use spreadsheets to calculate ad hoc values, tweak parameters and create manual data inputs that feed back into their operational systems. A miskeyed formula or outdated assumption in one of those side-spreadsheets can distort forecasts, stock levels or routing decisions across the entire operation - and nobody notices until the damage is done.
As organisations grow, over-reliance on spreadsheets for supply chain planning, operational controls and financial management becomes a liability rather than a convenience. Before getting into those challenges, it's worth looking at what Excel does well - and where it remains stubbornly embedded across supply chain operations.

The Pros of Excel in Supply Chain Management
Microsoft Excel, alongside Google Sheets, offers a broad set of features that support various supply chain management functions. These capabilities explain why spreadsheets remain a starting point for so many teams.
Data Analysis Tools
Excel's built-in functions - pivot tables, charting and data filtering - allow users to analyse large datasets and draw actionable conclusions. In supply chain management, where decisions depend on reading patterns across orders, stock movements and supplier performance, that analytical capability matters.
Formulas and Functions
The range of available formulas lets users automate calculations for inventory levels, lead times and demand forecasting. This automation reduces manual errors and gives a more accurate picture of operational data. There is a learning curve, though. Working with extensive datasets or complex calculations means someone on the team needs genuine spreadsheet expertise - not just copy-paste confidence.
Conditional Formatting
Conditional formatting highlights critical data points automatically. Inventory levels dropping below a threshold, overdue deliveries, cost overruns - all of these can be flagged at a glance without scanning cells one by one. It's a basic feature, but a useful one when working with thousands of rows.
Collaboration Capabilities
Cloud-based versions of Excel support multiple users working on the same document at once. For teams involved in supply chain coordination, this makes spreadsheets an accessible entry-level collaboration tool without the cost of dedicated project management software. Version history adds a further layer of transparency.
“The real risk isn't that teams use spreadsheets. It's that the spreadsheet becomes the system of record without anyone deciding it should be. One person builds a model, it works, people depend on it - and suddenly your demand planning runs on a file that lives on someone's laptop.”
Michael Ostroumov, Co-founder, FLOX

Where Excel Still Runs the Show
The 67% adoption figure is not just about basic data entry. Spreadsheets are embedded in specific, high-stakes supply chain processes - often filling gaps that enterprise systems leave open. Here is where they show up most frequently.
Demand Forecasting and Inventory Planning
Procurement and planning teams use spreadsheets to forecast demand, set reorder points, estimate safety stock and balance stockout risk against excess inventory. Excel's FORECAST.ETS function, moving averages and manual trend analysis remain standard practice for mid-market businesses. Even organisations with dedicated planning tools often export data to Excel for manual adjustments before feeding it back into their systems.
S&OP and Cross-Functional Planning
Sales and Operations Planning (S&OP) is supposed to align demand, supply, finance and commercial assumptions into one coherent plan. In practice, many organisations pull that alignment together in a spreadsheet. Monthly or weekly S&OP cycles often revolve around a master Excel file that gets passed between departments, each adding their own inputs and assumptions. The model works until it doesn't - version conflicts, broken formulas and stale data are routine.
Procurement Tracking and Supplier Management
Procurement teams track purchase orders, supplier scorecards, spend analysis, delivery dates and savings targets in spreadsheets. Excel-based procurement dashboards are common, particularly where organisations lack a dedicated source-to-pay platform. The flexibility is appealing: teams can build exactly the tracker they need. The downside is that the tracker only reflects what someone remembers to update.
Logistics and Transport Planning
Spreadsheets serve as a starting point for organising delivery data, assigning stops, building route plans and managing basic transport schedules. For smaller fleets or businesses managing a handful of daily deliveries, a well-structured spreadsheet does the job. But route optimisation, real-time replanning and multi-drop efficiency sit well beyond what a static spreadsheet can handle.
Operational Reporting, KPI Dashboards and Ad Hoc Analysis
A major reason Excel persists is speed. Pivot tables, charts and quick calculations let teams build KPI dashboards and run one-off analyses across inventory, procurement and logistics data without waiting for IT to build a report. That flexibility is genuine - it's why even well-resourced teams reach for a spreadsheet when they need an answer in 20 minutes rather than two weeks.
Scenario Modelling and Workaround Planning
Perhaps the most telling use case: many supply chain teams use Excel as a workaround layer around their ERP or planning systems. When the enterprise platform is too rigid for fast scenario modelling, exception handling or cross-functional collaboration, the spreadsheet fills the gap. Kinaxis has noted explicitly that spreadsheet-based planning remains widespread, particularly where enterprise tools are fragmented or slow to adapt. The spreadsheet becomes a shadow system - flexible, uncontrolled and invisible to governance.

The Cons of Excel in Supply Chain Management
The problems fall into two main categories.
Manual development, updates and maintenance
Building and maintaining a complex spreadsheet model is harder than it looks. Excel isn't designed for large-scale data management. As data volumes grow, performance degrades, formulas break and it becomes nearly impossible to transfer the knowledge locked in one person's model to another member of the team.
Excel's lack of data integrity rules and limited multi-user support make it difficult to maintain consistency across collaborating colleagues and cross-functional teams. The analytical constraints also bite: spreadsheets struggle to model the complex, interdependent relationships that exist in real supply chain operations. This leads to incomplete analysis and poor forecasting - exactly the areas where accuracy matters most.
Large, complex spreadsheet models demand a significant investment of time and effort. For most organisations past a certain scale, they're simply not the most effective tool for the job.
"Unacceptable" amount of errors
A study by the University of Hawaii found that spreadsheet errors are "pandemic." Errors appear in a few percent of all formula cells - which means that for any spreadsheet of meaningful size, the question is not whether errors exist but how many. Research by Coopers & Lybrand found that 90% of spreadsheets with more than 150 rows contained errors.
In non-critical applications, those errors may be an acceptable trade-off for affordability and ease of use. In supply chain operations, where a miscalculated reorder quantity can cascade into missed assembly deadlines, penalty charges, rush shipping costs and reputational damage, the trade-off looks very different.
The University of Hawaii study concluded that every piece of research that has attempted to measure spreadsheet errors has found them at rates that would be unacceptable in any organisation. When those errors feed into KPIs, dashboards or decision-support models, the consequences multiply.
For a deeper look at how technology is reshaping these processes, see our article on the transformative potential of AI in the supply chain.
Explore storage and fulfilment solutions that give your business flexibility and the support it needs to grow.

Malcolm Pope
Founder of Loguro
Chain Reaction Podcasts
Transform Logistics or Be Left Behind
Up to 30% of UK lorries run empty. Malcolm argues the logistics industry's biggest problem isn't technology — it's a stubborn refusal to collaborate.
When Spreadsheets Stop Scaling
The six use cases outlined above show why Excel remains so deeply embedded in supply chain operations. It's fast, it's familiar and it fills gaps that expensive enterprise systems often leave open. None of that changes the fact that spreadsheets were never designed to be operational systems.
The warning signs are consistent across organisations that have outgrown them:
- Customer lists and condition matrices too complex for a single workbook to manage reliably
- Multiple users editing the same files, creating version conflicts and silent data overwrites
- No real-time visibility into inventory movements or demand shifts
- Forecasting and scenario planning constrained by what formulas can express
- Process knowledge locked inside files that only one or two people understand
- No audit trail, no access controls, no governance over who changed what and when

These aren't edge cases. They're the norm for any supply chain operation of meaningful scale or complexity. And the organisations most at risk are often the ones that invested heavily in ERP and still run critical calculations in side-spreadsheets that sit outside any formal system.
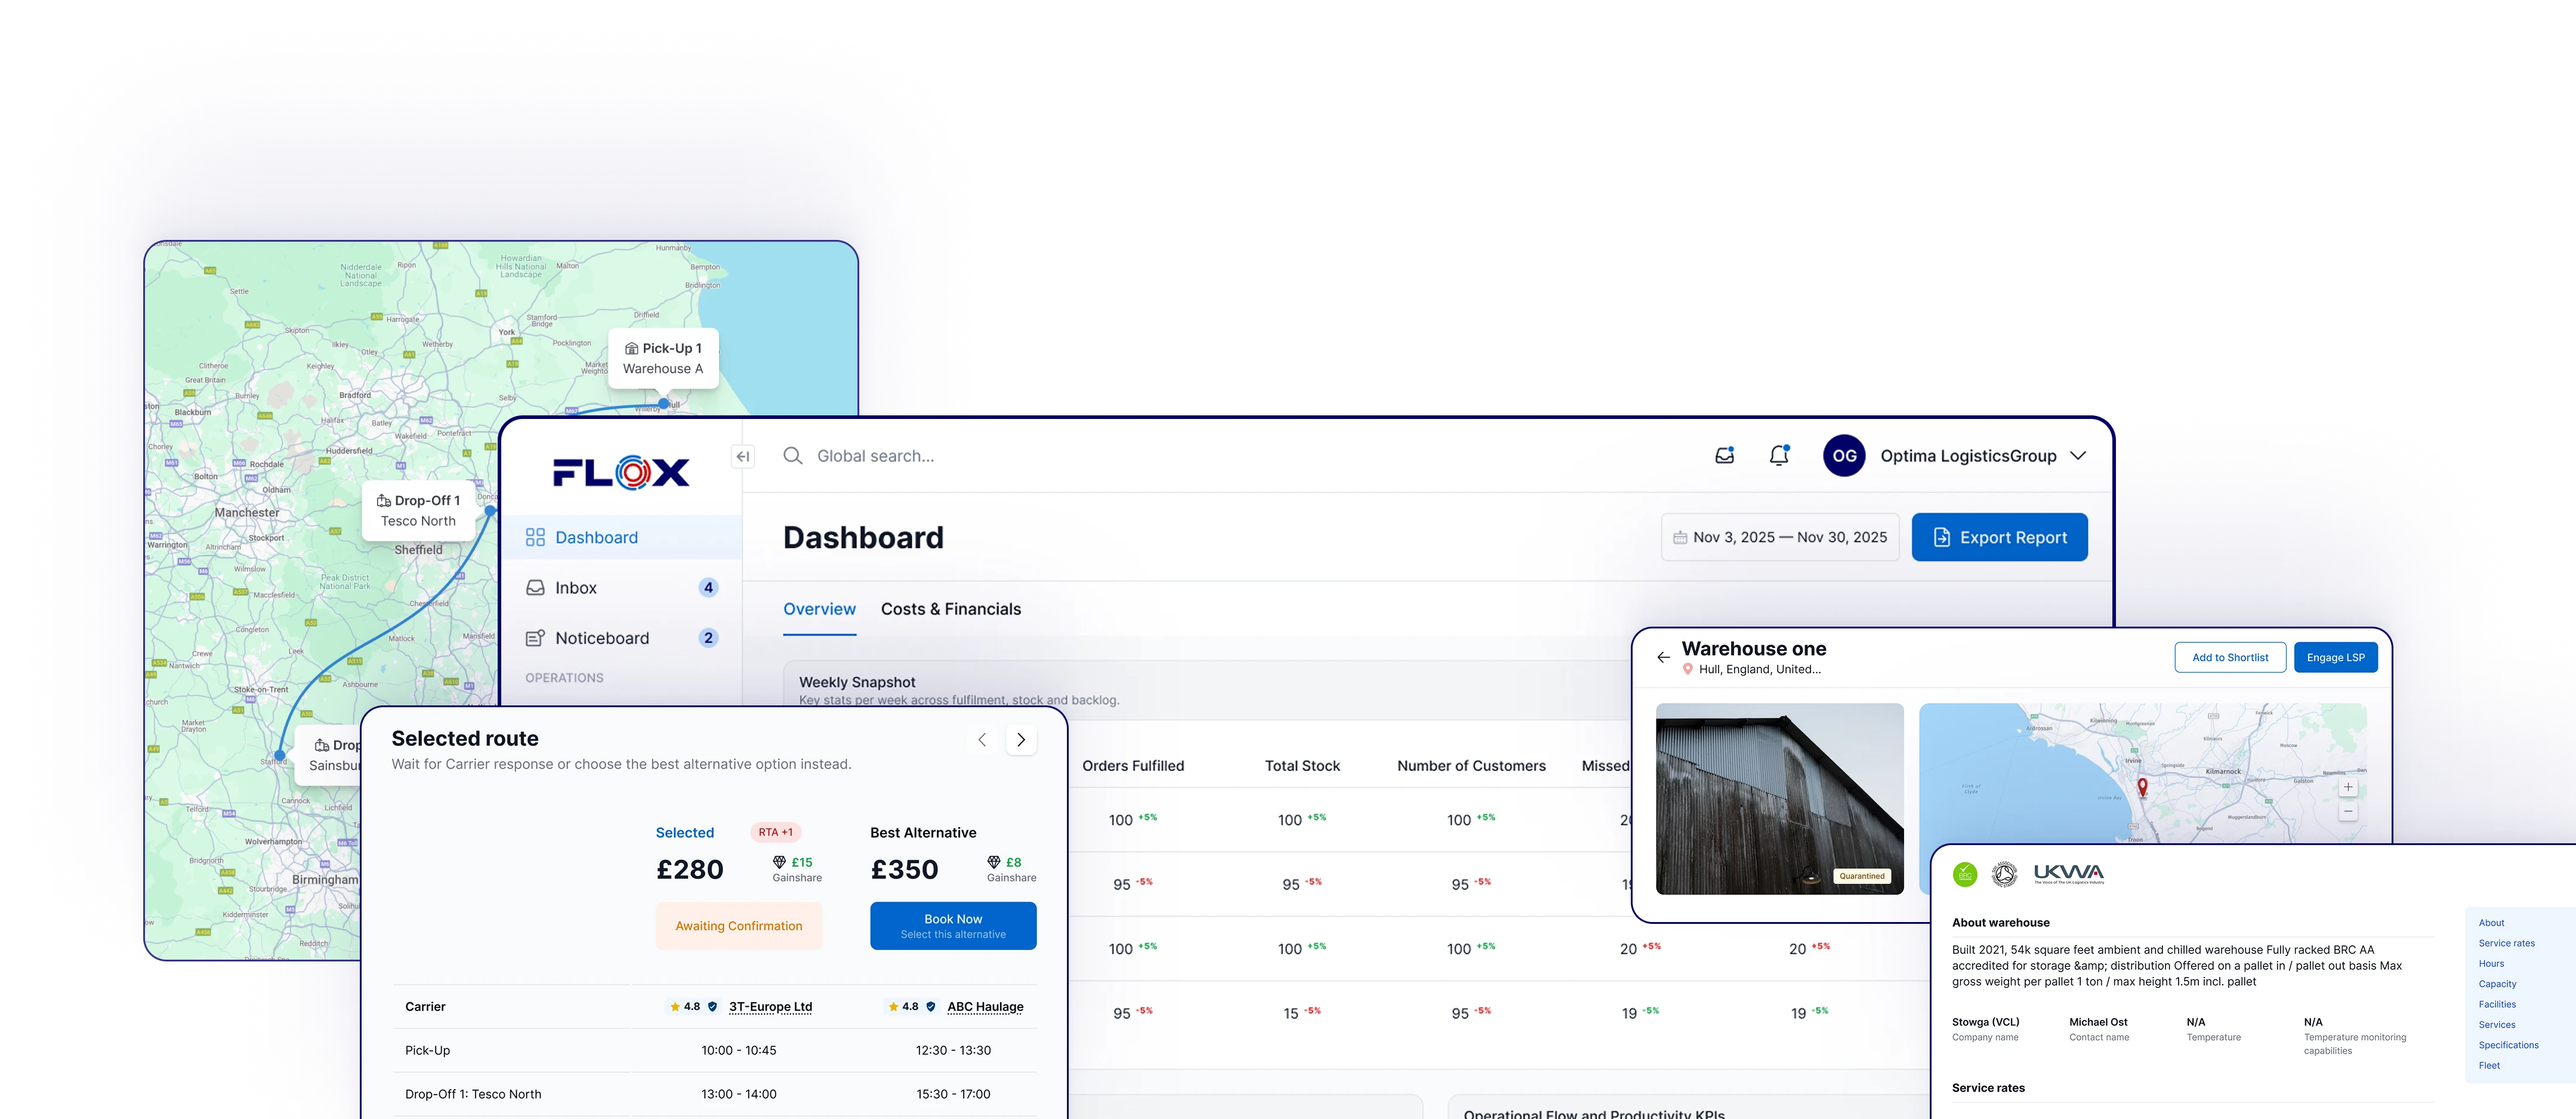
The shift away from spreadsheet-dependent supply chain management isn't about replacing Excel entirely. It's about recognising which processes need proper tooling - orchestration platforms, planning systems and collaborative logistics networks that connect buyers, warehouses, carriers and 3PLs with shared data and shared visibility. FLOX was built for exactly that transition: giving supply chain teams the coordination layer that spreadsheets can't provide, without asking them to abandon the flexibility they've come to rely on.
Subscribe to our newsletter.
Stay up to date with practical insights and useful logistics content
FAQs
Excel is affordable, widely available and quick to set up. Teams can build forecasting models, procurement trackers and KPI dashboards without waiting for IT resources or investing in dedicated software. According to an Adelante SCM survey, 67% of supply chain managers still use Excel as a management tool. Its flexibility makes it a natural first choice, particularly for ad hoc analysis and gap-filling around enterprise systems.